US COMMODITIES CORNER
Which categories are driving US dairy export growth?

Exports are becoming a vital market for US dairy products.
Historically, the US dairy market has been strictly a local and national market. Today an increasing percentage of dairy production is now being exported. To support this, the US Dairy Export Council (USDEC) was formed in 1995 to enhance demand for US dairy products. Nearly two decades after its formation, the council has helped develop a significant worldwide presence for US dairy products.
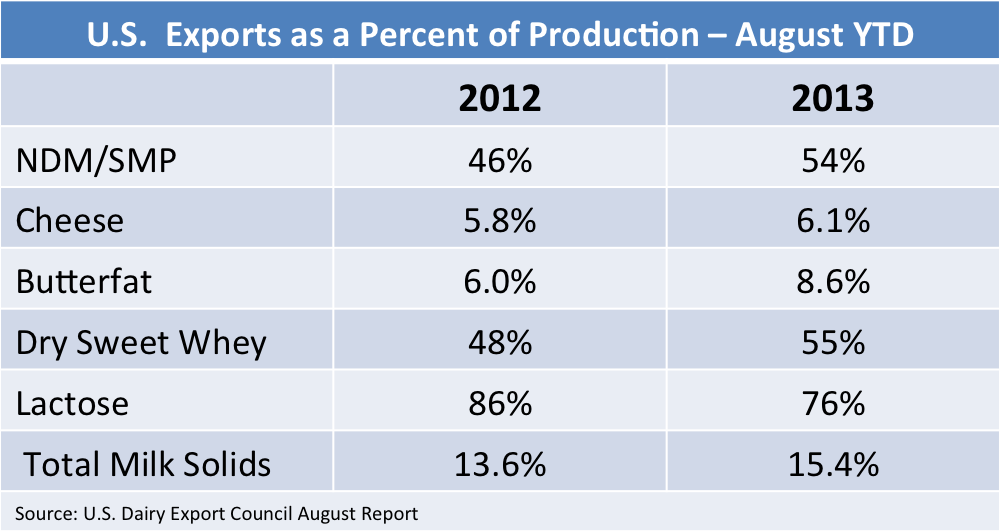
Neighboring Mexico remains the largest export market for US dairy products, but shipments to Asia and other parts of the world are growing. For the first eight months of 2013, 15.4% of US dairy solids were exported.
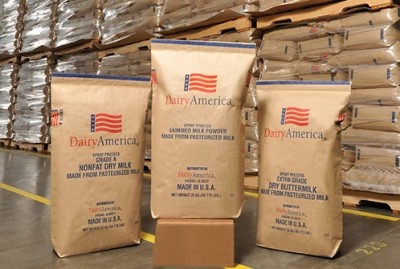
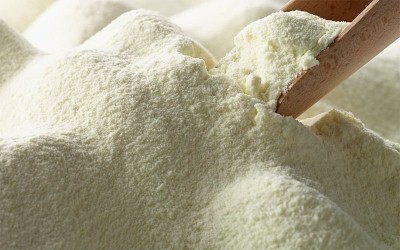
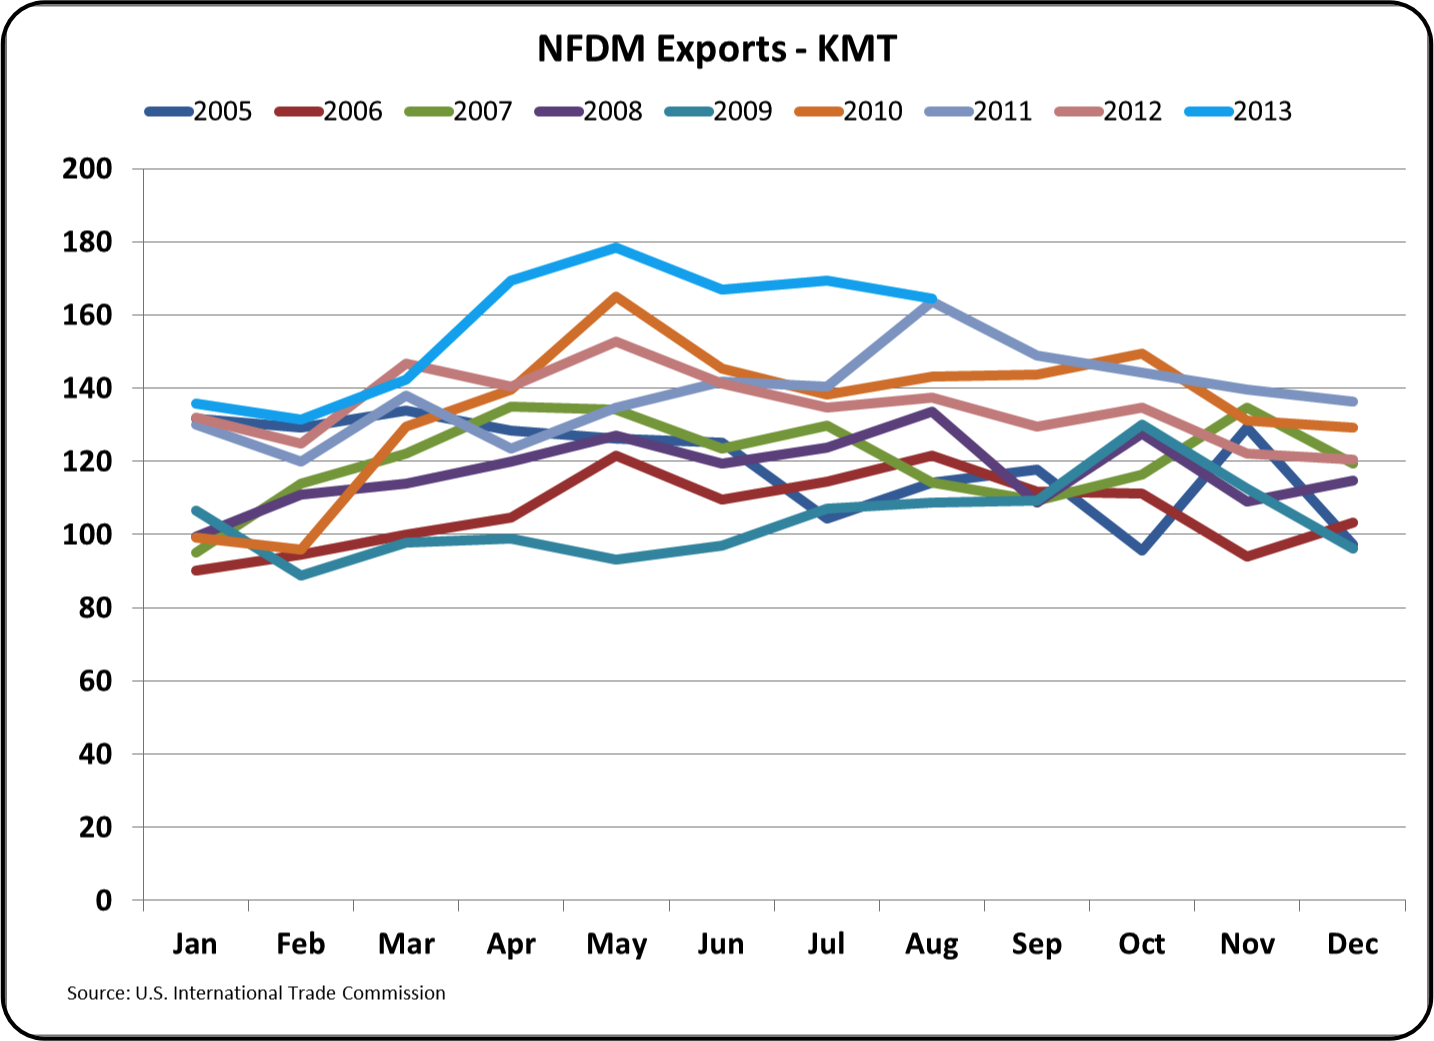
The US produces primarily non-fat dry milk, which does not have the guaranteed level of protein that skim milk powder has - but that has not limited demand for US non-fat dry milk.
The table above shows the increase in percent of production being exported (currently 54%).
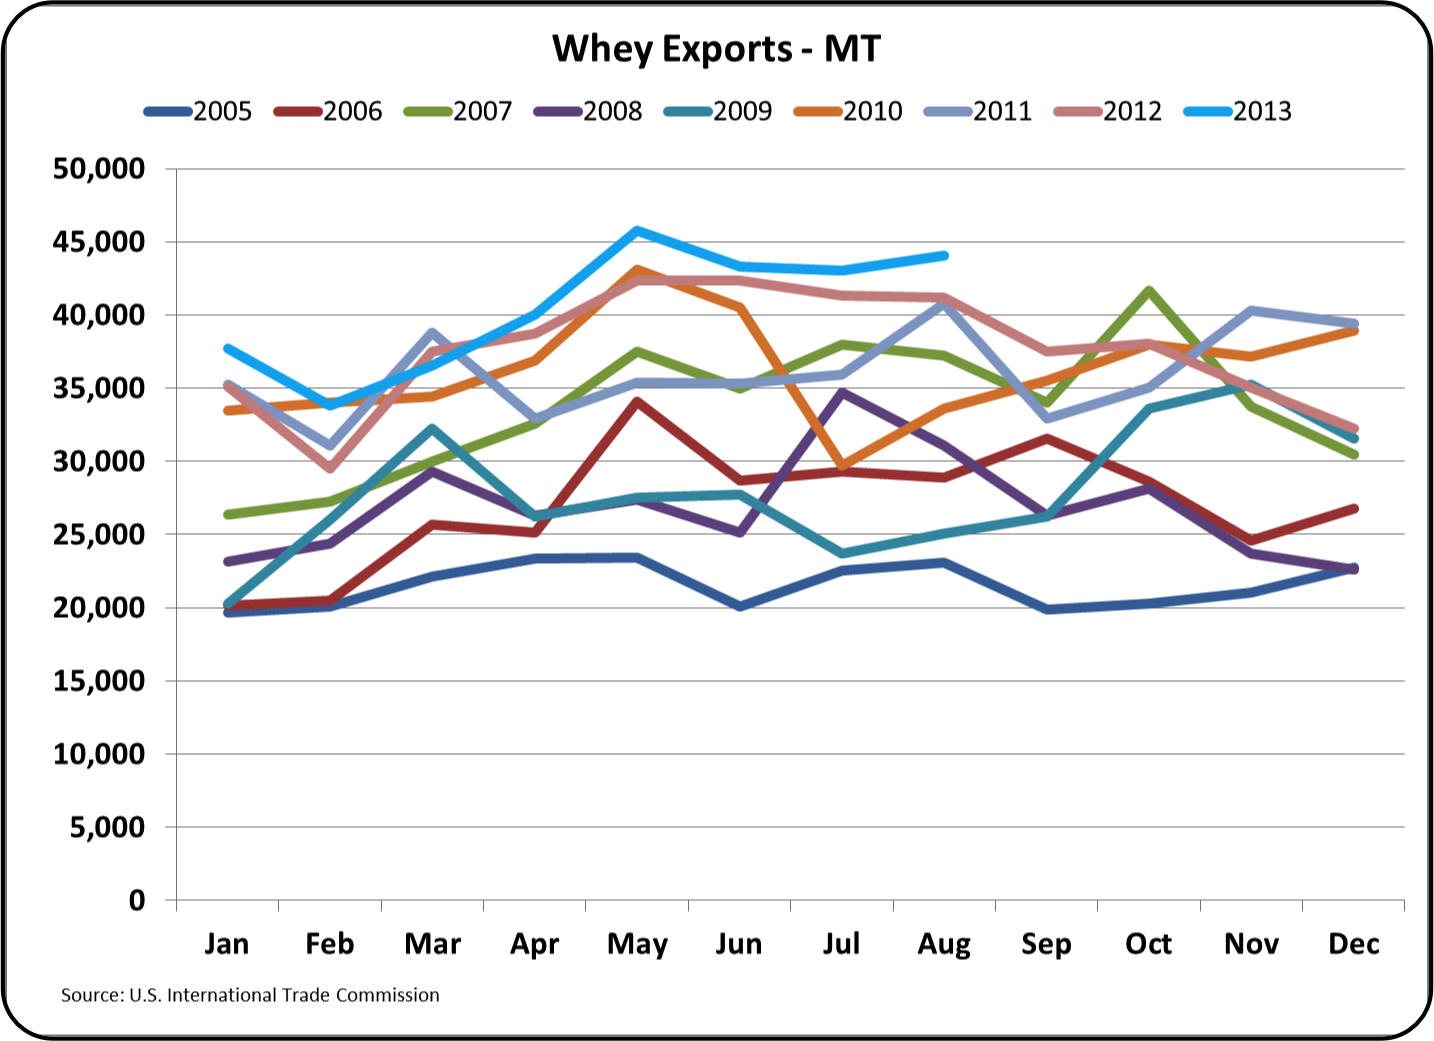
The chart below shows the growth of nonfat dry milk exported in metric tons. The blue line in these charts represents 2013.
To complete this picture, the wholesale price of nonfat dry milk has increased 27% since the start of 2012 due to increased demand. Over half of the nonfat dry milk is produced in the state of California.
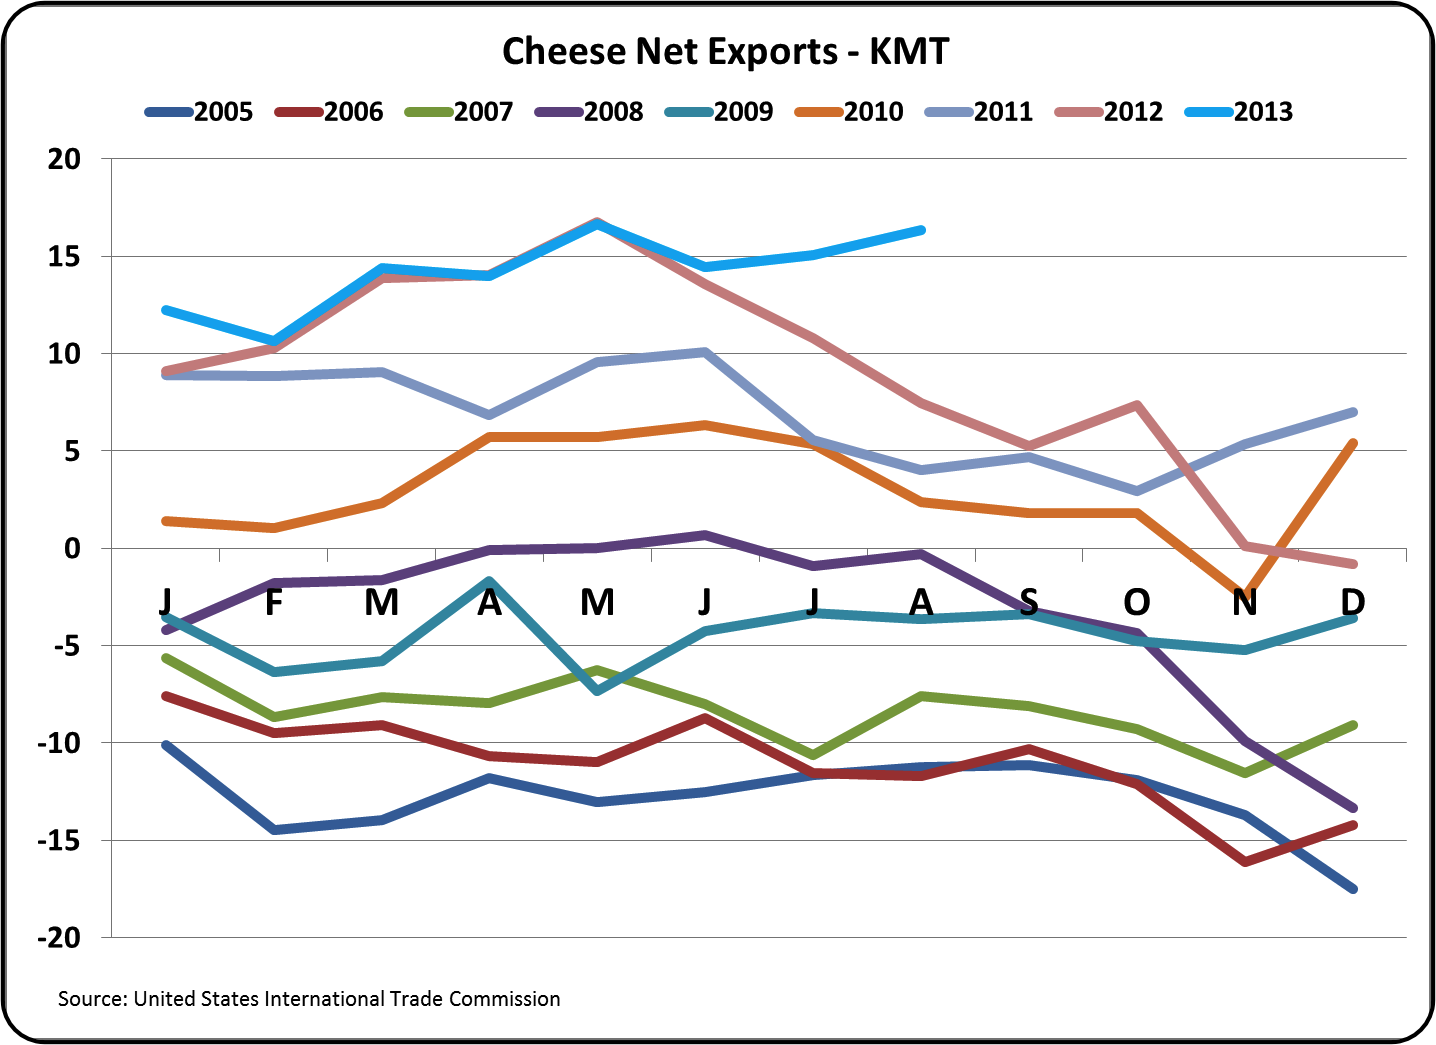
Demand for cheese is very important for US dairy producers as the Federal Milk Marketing Order (FMMO) primarily uses the price of cheese to calculate the minimal price for most US milk.
The amount of cheese exported is a rather low 6.1% as there is strong and growing domestic demand for cheese, however, cheese exports are growing in volume and in percent of cheese production. The majority of cheese is produced in Wisconsin and California.
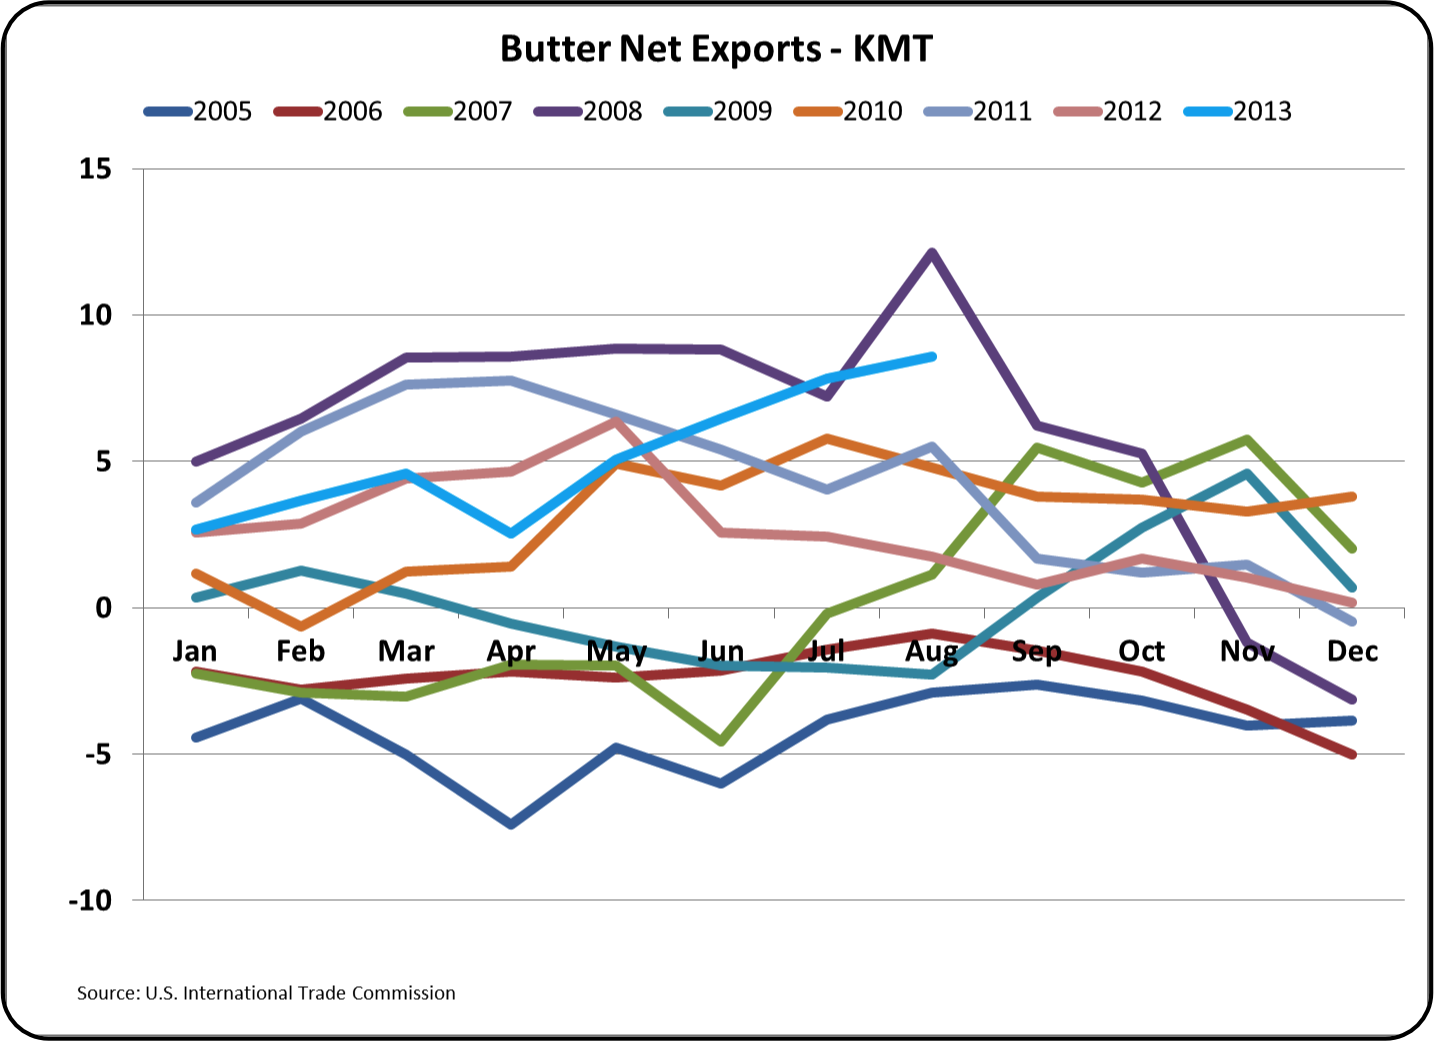
Exports of butterfat are currently 8.6% of production. However the growth of this market has been erratic. Because butterfat is the co-product of nonfat dry milk production, a lot of the exported butterfat comes from California.
Sweet whey is a by-product (or maybe a co-product) of cheese manufacturing. Where only 6.1% of cheese is exported, 55% of the dry whey is exported. As the market for dry whey has developed over the last five years the wholesale price has also risen significantly.
One of the factors influencing export sales is exchange rates.
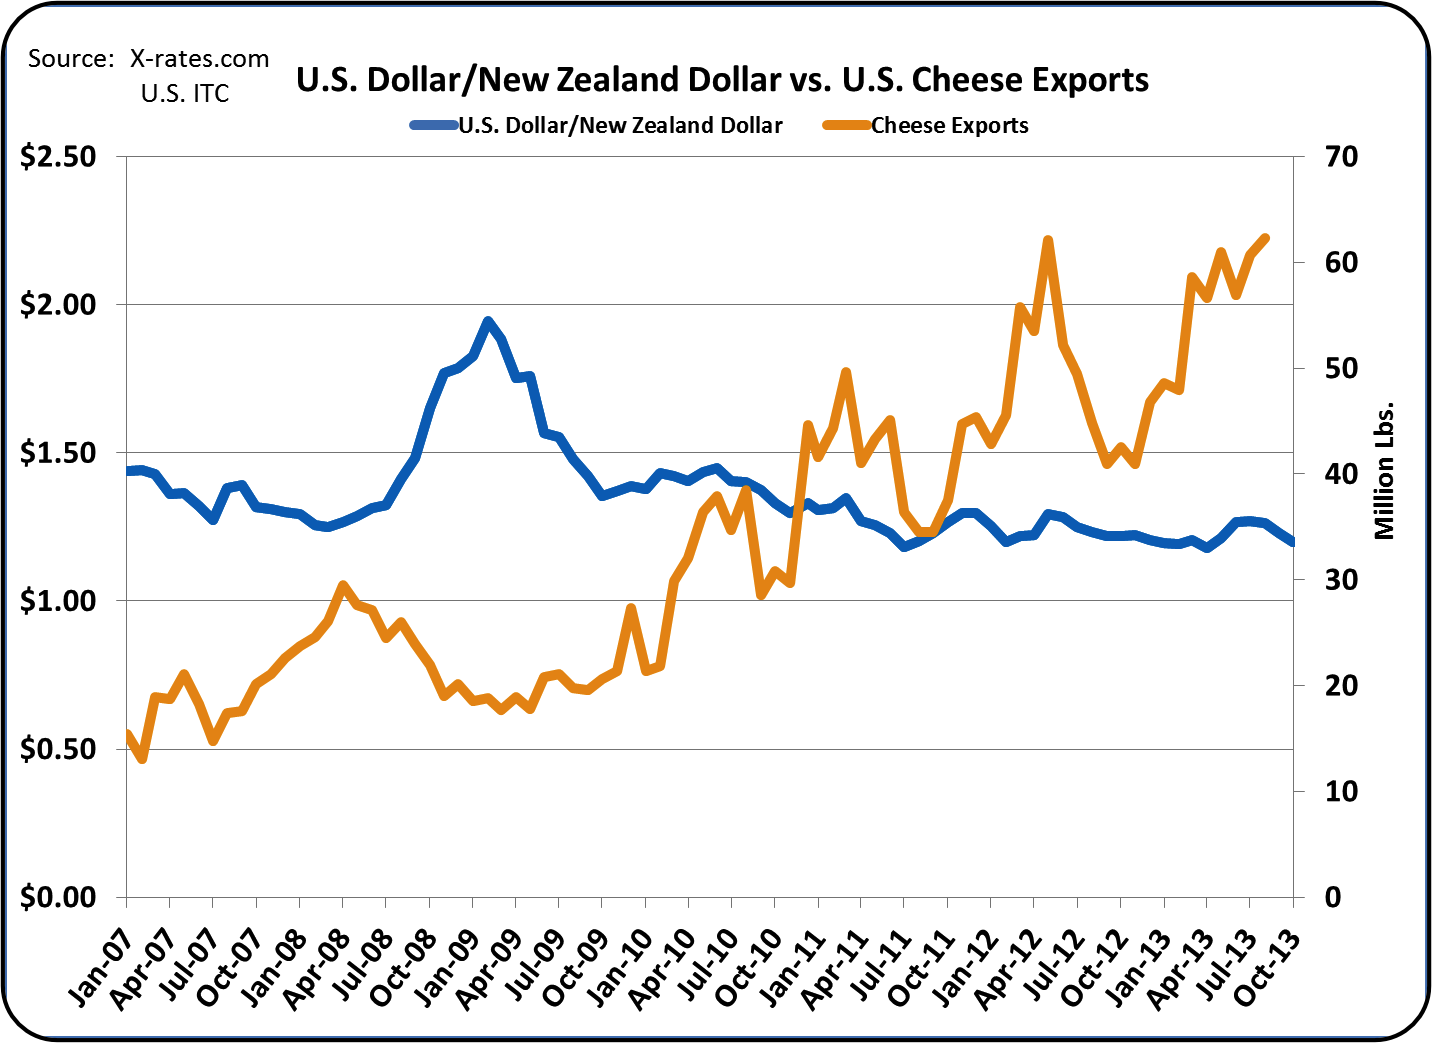
The chart above shows the relationship between the US Dollar (US$) and the New Zealand Dollar (NZ$) versus exports of cheese.

A weak US$ drove a doubling of cheese exports in 2007/8, but the strong US$ in late 2008/9 reduced these exports by 70%.
John Geuss is the editor of US dairy commodities blog, MilkPrice.
For an in-depth examination of last month's American dairy commodity movements, visit MilkPrice.