The Class III milk price was $18.02 per hundredweight (cwt), down 3% from the prior month.
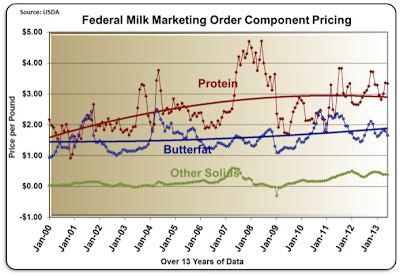
Cheese prices also fell 3% and butter prices fell 6%. Milk protein was stable at $3.35 per pound (lb), but milk fat took a significant 7% drop to $1.66 per lb.
Inventories of cheese and butter remain very high and if not reduced, will weigh heavily on future pricing.

Long term trends for Class III components remain the same. Milk protein is showing expected strength at twice the value of milk fat. 'Other solids' is maintaining its new value range with only a slight drop in pricing at $0.39 per lb.
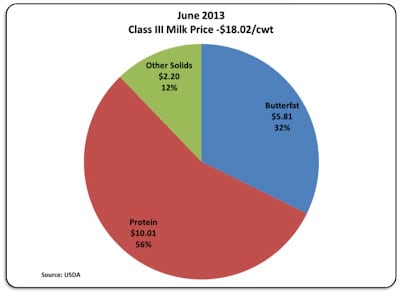
As a result of the changes, the percentage of the milk check that comes from milk protein jumped to 56% of the Class III price.
This chart (right) is based on the USDA standard of 3.5% milk fat and 3.0% milk protein. Clearly, the best revenue path for a producer is to increase milk protein. Amino acid balancing of feed is key to achieving higher milk protein and higher milk revenue.

Exports of cheese and butter have continued at 2012 levels. As a result, the inventories of cheese and butter have increased from the prior month.
Whey and nonfat dry milk exports are up slightly.
The 'Cheese heads'
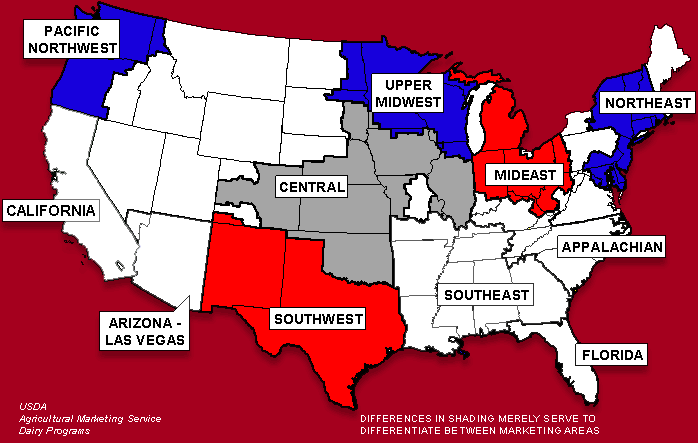
There are ten active Federal Milk Orders in the U.S.
Six of these pay strictly on components and the other four pay based on cwt of skim milk and butterfat content.
The six that pay on components make up 50% of the total U.S. milk volume and the other four make up 10%.
California has their own payment system, which accounts for 21% of the U.S. milk and the remaining 19% are not regulated.

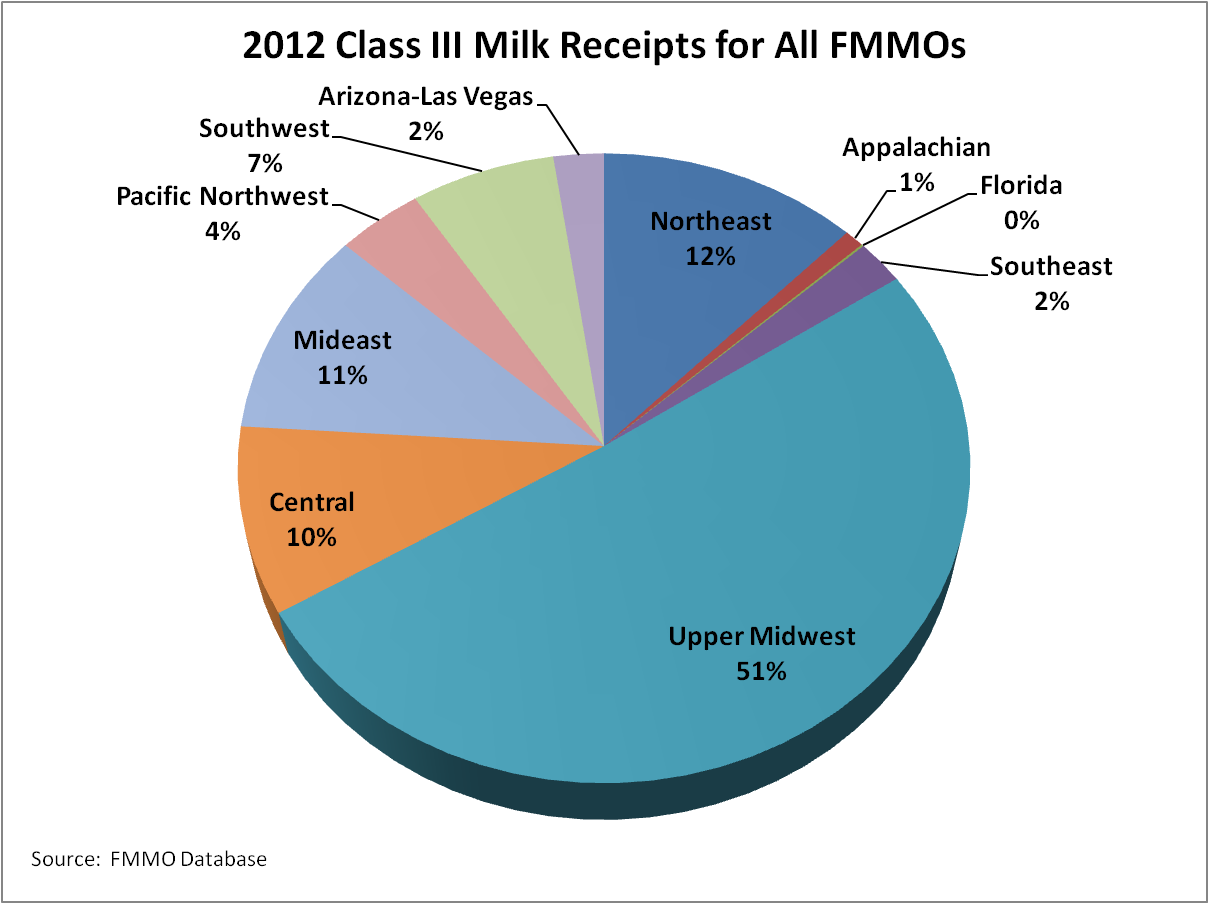
Of the ten Federal Milk Marketing Orders, one is significantly bigger than all the rest. That one is the Upper Midwest Federal Order, which makes up more than 50% of the milk controlled by the Federal Milk Marketing Order system.
This one Federal Order makes up 26% of the U.S. total milk.

However, in reality, the Upper Midwest is actually even larger.
There are complex rules that allow a producer to not include his milk in the Federal Order pool if it is advantageous to not pool the milk. This happens with increasing frequency in the Upper Midwest. In 2012, nearly 20% of the milk from the Upper Midwest was 'de-pooled'.
While technically, this 'de-pooled' milk is not controlled by the Federal Order system it is typically paid by the same component pricing as the pooled milk.
That means that the Upper Midwest makes up over 30% of the milk sold in the U.S. It is also the fastest growing milk producing area in the U.S. Over 80% of the milk from the Upper Midwest goes to cheese manufacturing.

The dairy state of Wisconsin is the heart of the Upper Midwest. For good reason, citizens of Wisconsin are often referred as 'Cheese heads'.
US-based John Geuss is the editor of US dairy commodities blog, MilkPrice.
For more of John's in-depth month-to-month dairy commodity price updates, click here.
