Growth in demand for butter has been very different for cheese.
Per capita consumption has been stable but not growing for years as alternate products are available.
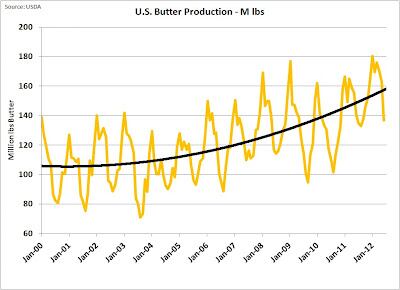
Demand has developed based on population growth and exports. Butter production has grown more than 45% over the last 12 years.
Comparatively, butter production has grown faster than cheese production.
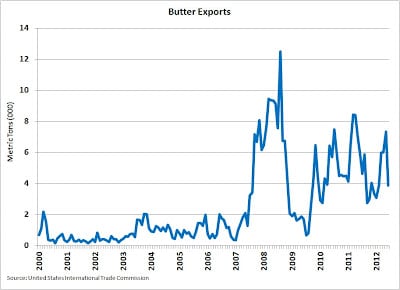
The growth is driven primarily by exports. Note the higher export levels shown in chart four (right) in 2008 required increased production as shown in chart one (above left) for 2008 and 2009.
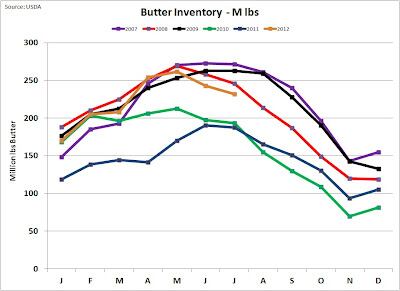
Butter exports created an inventory shortage in 2008 which was recovered in 2009 with lower exports and continued high butter production.
Butter has reached equilibrium in 2012. Good production and exports well below the 2008 record year let inventories return to normal levels.
Recently butter inventories show a little shortage developing which is starting to have an impact on pricing.
Other solids
Other solids pricing is driven by whey prices. The USDA formula is: Other Solids Price = (Dry whey price – 0.1991) times 1.03.
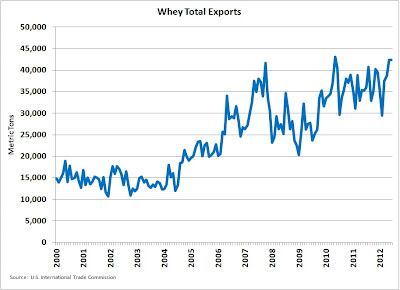
Dry whey is a major export item which has seen growth of nearly 250% over the last 12 years.
Whey inventories shown in chart four (right) have been decreasing as demand has increased.
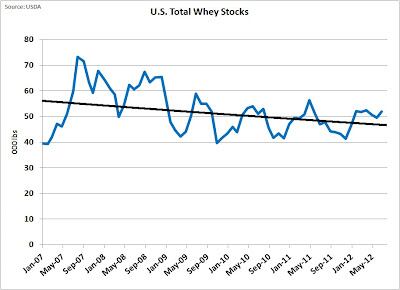
Whey is a by-product of cheese manufacturing. It consists primarily of lactose and non-casein proteins. Whey is finding higher value uses and is becoming more in demand, but production is limited by the amount of cheese produced.
"Other Solids" has attained a higher value in the last two years and may stay or even increase further in value as demand outstrips supply.
Looking ahead
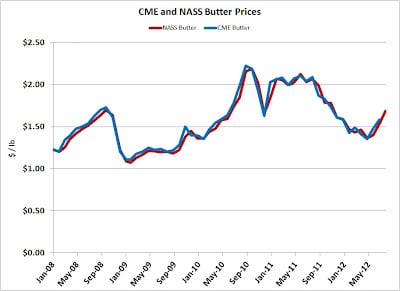
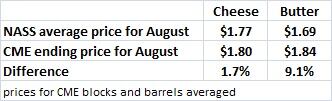
NASS cheese prices for August were $1.77/lb and butter prices were $1.69/lb. NASS cheese prices lag the CME by about two weeks and butter prices track very closely. Chart six (right) shows the tight correlation between CME and NASS butter prices.
At the end of August, CME prices for cheese blocks were $1.82/lb and cheese barrels were $1.78/lb. Both were very close to the August NASS prices of $1.77/lb which is used in the milk protein pricing calculation.
However, butter prices on the CME on the last day of August were $1.84.lb, well above the average NASS prices for August of $1.69.
In the immediate future, it seems fairly certain that butter (and therefore butterfat) will increase faster than cheese (and therefore milk protein).
Remember that as butter increases in value, it has a positive impact on butterfat prices and a negative impact on the value of milk protein. As of the date of this post, Class II milk futures for November and December 2012 are at $19.97/cwt.
You can see John's month-to-month dairy commodity breakdowns at his blog, MilkPrice.