US COMMODITIES CORNER
Commodities expert John Geuss on July: All Milk Producer Prices are Up!

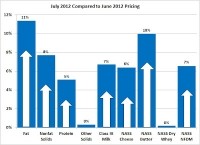
Dry whey and the milk "other solids" price, which is calculated from the dry whey price, were up less than 1%, but the more important component pricing for milk protein and butterfat were up 5% and 11% respectively. The Class III milk price increased by 7% to $16.68/cwt.
Milk protein and butterfat prices showed nice gains. However, at $3.04/lb, milk
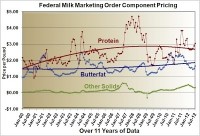
protein is not even close to its all time high of $4.71/lb. The highest price for butterfat in the last five years was $2.37 in June, 2011 which is also well above the current $1.66/lb. These comparisons are made to show the volatility of the milk component pricing and to show that under certain economic conditions, much higher prices can result. While the current pricing is above the long term averages, there is plenty of room for additional upward movement.
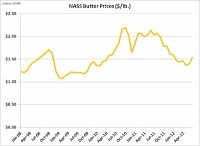
The factors that determine these milk component prices are the butter and cheese prices. Butter was up 10% and cheese was up 6% over the prior month. When butter increases,
butterfat goes up in value, but milk protein goes down because the difference in the value of butterfat in cheese vs. butter decreases. As analyzed in detail below, there appears to be a greater chance for milk protein to increase in value in the coming months than for butterfat.
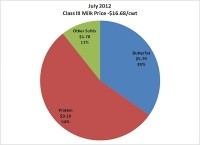
With these changes, the milk check shifted again emphasizing the importance of milk protein in producers' checks. Payment for milk protein made up 54% of the Class III standard milk check in July.
Long term milk protein focus
Before analyzing the current trends for cheese and butter pricing, a few charts will be shown on why milk protein is such an important long term focus for producers. Protein is necessary for cheese production (see Van Slyke's book on "The Science and Practice of Cheese-Making" for details). Often non-fat dry milk is added to bring milk protein to the optimal levels for cheese production. Processors need milk high in protein to economically manufacture cheese. Cheese is the growth vehicle for the U.S. dairy industry.
The data shown below is from the OECD (Organization of Economic Co-operation and Development) database.
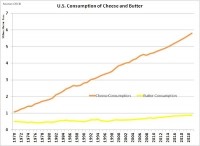
Per capita consumption of butter has been stagnating for many decades. The only increases are related to population increases. Cheese consumption has been growing and is expected to continue to grow. Per capita consumption of cheese in the U.S. is still well below European levels, so there is obviously room for increased consumption.
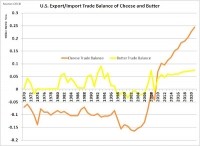
The trade balance is the net of exports minus imports. The cheese trade balance became positive (exports larger than imports) starting in 2010. This trend is expected to continue. While the butter trade balance is expected to remain positive, only a small increase in tonnage is expected.
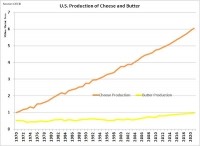
Production of cheese and butter follows the patterns of U.S. consumption and exports with big increases for cheese and almost no increase in butter production.
Cheese is clearly becoming the primary driver of the U.S. dairy industry. Economical production of cheese requires high milk protein.
Cheese - Current status
The demand for cheese, driven by strong exports, is continuing and with higher demand, a higher price can be expected. Exports continue to set new records. Cheese inventories are staying in line with normal expectations.
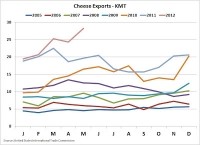
Although export data lags by a few months, through May, exports are very strong, approaching 30 thousand metric tons per month. This is occurring even with a relatively strong USD. As the future of the EU evolves, it is possible that the Euro may weaken further against the USD, but the ability to increase exports in the current economic environment indicates that the U.S. Dairy business is remaining competitive on the world markets.
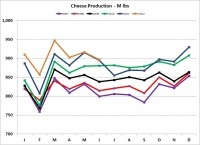
Cheese production continues to increase following the historical trends. The annual cycle results from the limited days in the month of February and a seasonal increase toward the end of the year to prepare for increased consumption for the holidays. While the months of May and June are lower than March, they are typical and only appear lower when compared to 2011 which was atypical.
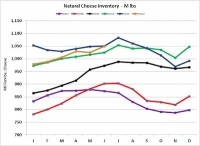
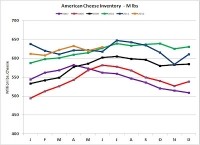
Inventories of Natural cheese and American cheese have remained in line with the prior two years even though production has climbed.
Both Natural cheese and American cheese inventories are shown because they cannot easily be combined. American cheese is a processed cheese product which contains natural cheese but has other products such as whey added back to make a product that tastes like cheese but has some convenient cooking
characterizes like a consistent melting point.
Overall, the cheese market seems to be in a very healthy position. There are no high inventories that can cause price erosion and exports remain robust. Pricing will probably remain near current levels or increase a little.
Butter - Current Status
Butter statistics show a market that is stable, but with no significant movement.
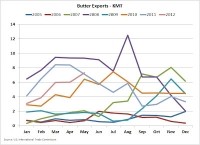
Butter exports remain near the levels of 2010/11. These export levels are not record setting but are consistent with a long term stable market.
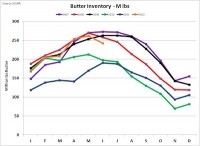
Butter inventories are reasonable for this time of the year. They have recovered from the low levels of 2010/11. The June inventories show a slight drop from the norm which could play into higher prices. The inventory levels need to be
watched carefully over the next few months to see if inventory levels are shrinking to the point of shortage which would create another pricing bubble.
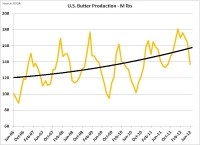
Butter production is following normal seasonal patterns, with a little weakness recently. The extremely hot weather in the Midwest is impacting milk production and reducing the amount of milk available for butter production.
Therefore butter prices remain near historic levels.
There is not much movement concerning butter regardless of the 10% price increase that occurred in July. The 2012 summer heat may come into play in butterfat availability and may be contributing to the recent price increase. New month's data will tell more on this.
Looking ahead
The summer heat and the Midwestern drought will impact dairy prices and profitability. High feed costs will probably force a reduction in the number of cows and the number of dairy operations. Margins will be slim. However, the milk futures do show expected improvement in milk prices. Some producers may take advantage of the higher futures prices to lock in margins.
Those looking further into the future should look closely at the genetics and nutrition needed to impact higher milk protein levels.
You can see John's month-to-month dairy commidity breakdowns at his blog, MilkPrice.
